Saying the last few years in California agriculture have been "rough" is an understatement. From a multi-year drought and wildfires to extreme rain and floods... and now we're facing the highest energy costs in the United States! Here's what's going on - and what you need to know to stay ahead.
California Energy Market: The Nation's Largest And Most Expensive "Time of Use" (TOU) Energy Rate Rollout
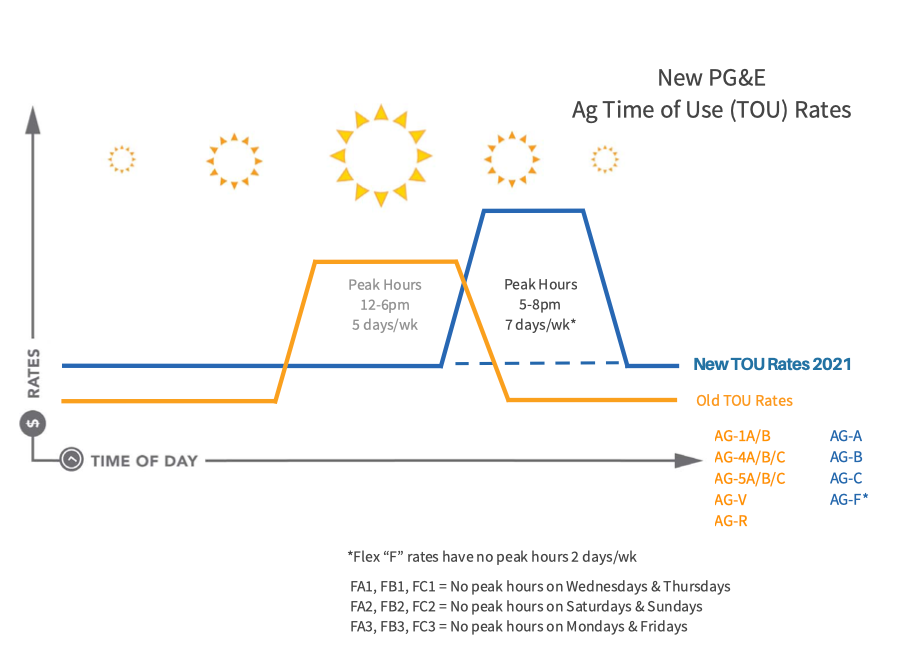
In 2021, California rolled out the nation's largest Time of Use (TOU) utility rate changes. Time Of Use means you pay more for energy during "peak" times of the day when the utility grid has the most demand for energy. The days of paying a "flat" rate for electricity are no more.
As a result, Californians now pay TRIPLE the national average in energy rates - and they're set to get even higher soon - as much as 30% higher thanks to requested rate hikes from PG&E to pay for their wildfire liabilities.
Don't believe it? Check out this article from Agri-Pulse: PG&E grilled in Legislature over energy rates for agriculture.
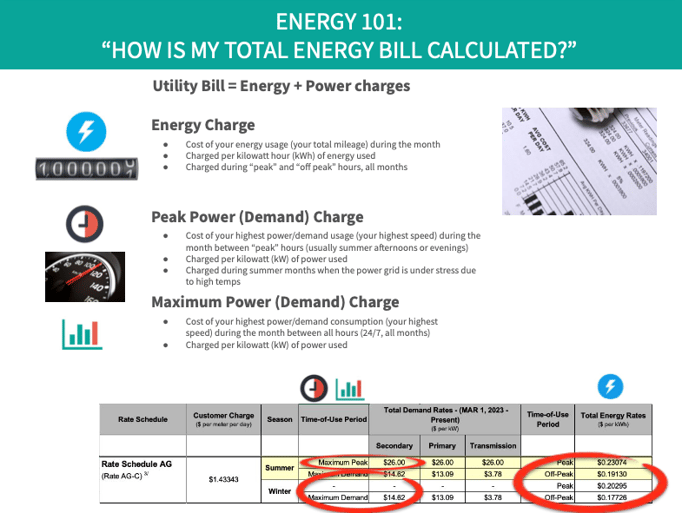
Energy 101: How Is My Utility Bill Calculated?
Before we dive into the latest cost hikes and how to avoid them, it's really important to understand HOW your energy bill is calculated and what your bill charges actually mean. (If you're already well-versed in this - just skip down to next section)...
Time of Use (TOU): WHEN you use energy is just as important as HOW MUCH you use
Under the new TOU rates, you pay more for electricity during weekday AND weekend afternoons between 5pm-8pm, seven days a week. And those costs on your utility bill are broken out between two different types of costs: energy charges and power (i.e "demand") charges.
Your Utility Bill = Energy + Power Charges
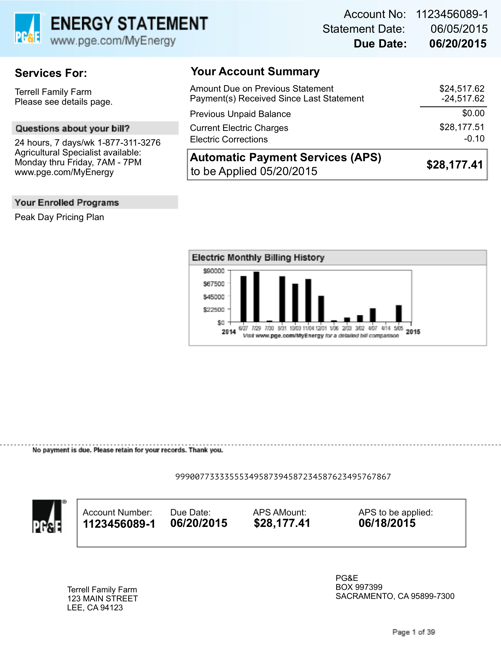
A sample utility bill from PG&E.
Energy Usage (the "odometer")

- Cost of your energy usage - your total mileage - during the month between all hours 24/7, all year
- Charged per kilowatt hour (kWh) of energy used
Peak Energy Usage (the "odometer")
- Cost of your energy usage - your total mileage - during the month between “peak” hours only
- Charged per kilowatt hour (kWh) of energy used
- Charged during summer months when the power grid is under stress due to high temps

- Cost of your highest power/demand consumption - your highest speed - during the month between all hours 24/7, all year
- Charged per kilowatt (kW) of power used
Peak Power Usage (the "speedometer')
- Cost of your highest power/demand usage - your highest speed - during the month between “peak” hours - usually summer afternoons or evenings
- Charged per kilowatt (kW) of power used
- Charged during summer months when the power grid is under stress due to high temps
Confusing? YES. And it's designed to be that way so you just give up and pay your bill without asking too many questions. Hopefully our charts below explain it a little more clearly:
Check out this specific example and breakdown for an irrigation pump on a PG&E "agricultural" utility rate:
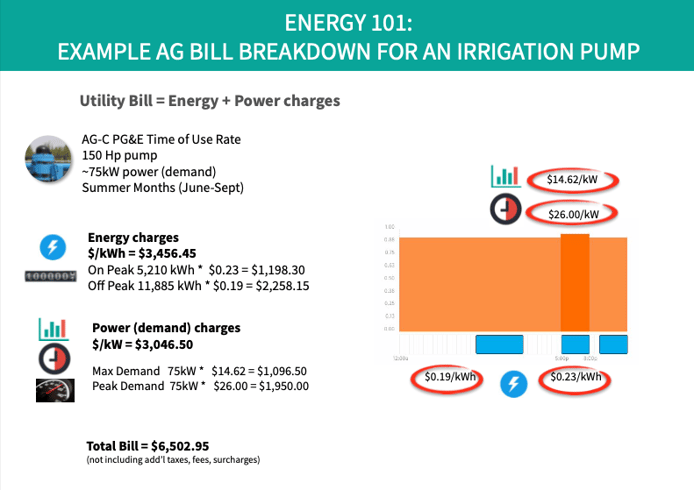
As you can see above, irrigating with this one pump during the summer when crops need the most water would cost ~$6,500 in energy and power costs for a single month. Multiply that by dozens of electric irrigation pumps across a farm and utility bills can easily climb into the hundreds of thousands of dollars PER MONTH.
During the "peak" evening hours from 5-8pm, both the energy "demand" costs and the power "demand" costs get very expensive and eat up almost HALF of a utility bill.
So avoiding or offsetting energy + power usage during these hours could result in monthly bill savings of up to 50%.
What Are The New TOU Charges?
On average, these new TOU rates cost about $0.45/kWh when you include or "blend" in the peak power demand and peak energy costs.
By comparison, the average cost of energy in the United States is only $0.15/kWh.
To add insult to injury, peak power "demand" costs can reach as high as $26 PER KILOWATT (kW)!
- 💸 PG&E AG-A rates are now ~$0.46/kWh
- 💸 PG&E AG-B rates are now ~$0.42/kWh
- 💸 PG&E AG-C peak demand charge increased ~$7 to $26/kW
- 😱 PG&E AG-FA peak energy charge is now $0.53/kWh
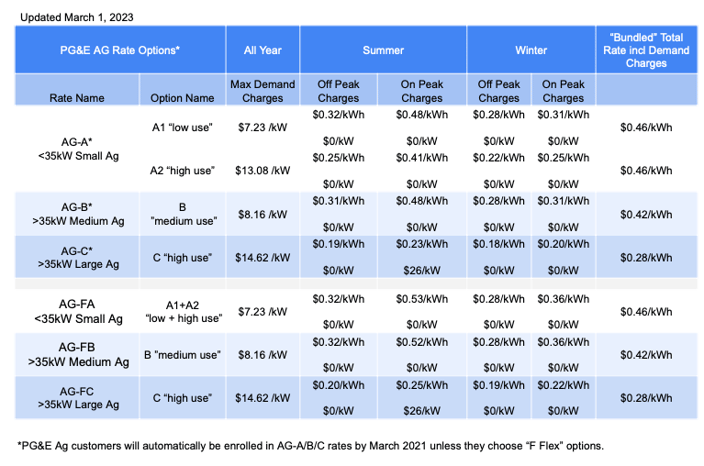
Recent cost breakdown by PG&E Agricultural rate, showing both energy and demand charges.
So why is all of this changing now? Flattening out the "Duck Curve"
California has produced so much renewable energy in the form of solar and wind power that there's now a glut of excess power - generally in the afternoons when the sun is shining and the wind is blowing.
So the state now needs to flatten out this imbalance by incentivizing grid customers to use MORE energy in the afternoon and LESS in the evenings. Or store it.
This new grid imbalance is referred to in the energy industry as the "duck curve":
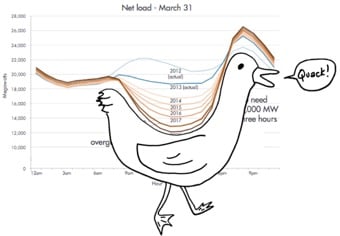
The "duck curve" with a midday drop in power consumption in Megawatts across California due to over-production of renewable energy. Credit: vox.com
Another reason for the rate changes (that doesn't get talked about as much) is the fact that it's expensive for utilities to run "standby" power plants to meet this imbalance. These "standby" plants are referred to in the energy industry as “peaker plants” that are typically fueled by natural gas which can be subject to price swings in energy markets and environmental regulations. The 2021 winter storm fiasco in Texas is a perfect example of this!
The ultimate goal is to be able to store excess solar/wind energy with on-site batteries, or some other form of energy storage - including hydrogen fuel cells. So the new rates have been built to incentivize this and make grid loads more predictable.
And let's be honest, this also siphons more money out of our pockets to go to monopoly utility companies that have had horrendous safety records and declared bankruptcy in recent years due to sparking massive wildfires, resulting in lost lives and billions of dollars in damage to communities (looking at you, PG&E).
NEM 3.0 - What the heck is going on?
Rubbing salt in the wound of already-sky-high energy costs, in December 2022 the California Public Utility Commission (CPUC) passed a new regulation collectively referred to as "NEM 3.0."
This new ruling heavily favors incumbent utility companies over solar producers/consumers and private solar installers. Over the past decade, a rooftop solar producer would be well-compensated for all excess energy they sent back to the grid i.e. "net metering" by as much as $0.25/kWh. These systems could pay for themselves within a few years and customers could essentially wipe out their energy costs, while saving $ millions in utility bills over the 20 year life of the solar system.
Now, these net metering incentives are being slashed by ~75%. This essentially guts the economics of installing your own solar panels and makes it very difficult to break even on your solar investment. It also incentivizes utility customers to install expensive, on-site batteries to store excess energy and discharge it during expensive "peak" hours - assuming they can afford the equipment and installation costs and the $ savings math pencils out.
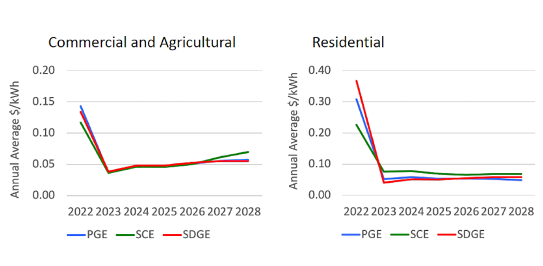
Chart showing the drop in California utility net metering incentives approved by the CPUC in December 2022. Credit: SEIA
So what's the bottom line for my farm?
Farms that have invested in on-site solar projects need to watch this closely. They may - or may not - see their original expected savings and ROI promised by their original solar contract now that these new rates are live.
Older solar projects that were connected to the grid can keep their net energy metering (NEM) on their original utility rate plans i.e. "grandfathering" at least for a few more years. Newer solar projects, however, don't have this option and will have to enroll in the new, costlier rate plans. For larger operations, investing in on-site energy storage or battery systems could be a compelling option to avoid the new, costly peak hours between 5-8pm - assuming you can afford the equipment and installation costs.
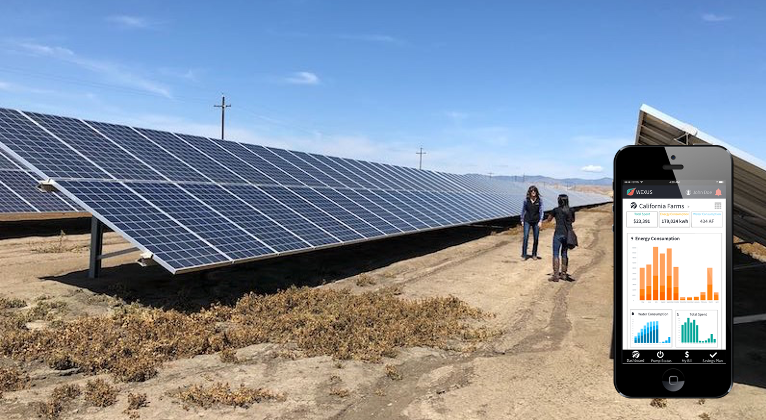
Our software quickly analyzes these new TOU rates and matches them with your energy bills and consumption, your solar generation, and your irrigation pump loads over the past few years to automatically select the cheapest TOU rates and maximize your cost savings. Doing this manually is impossible.
 Wexus "cost calculator" tool helps predict your energy and demand costs in advance, based on your estimated usage/irrigation schedule.
Wexus also tracks and monitors your solar assets for you. It tracks your "grandfathered" solar rates and solar meters so that you don't prematurely switch to a different solar rate. Wexus monitors your solar systems' performance and flags any operations/maintenance costs to keep your system running in top shape. This helps to maximize your solar ROI and keep your $ savings on track. Our software also identifies sites and meters/consumers that may be good candidates for new solar arrays and/or energy storage systems - based on your historical energy usage, costs and irrigation schedules.
 Wexus "solar dashboard" tracks your solar energy production, consumption, solar bills and ROI all in one place.
All of these changes are clear as mud. I have a business to run. What should I do next?
You're not alone. We're seeing changes in the energy landscape faster than ever before. So leave the heavy-lifting to the energy engineers of Team Wexus.
- For more information about how Wexus can help you drive energy and water efficiency, automation and cost savings check out our home page here where you can schedule a demo of our software platform or sign up for a free proposal. And if you know any growers, food processors or water districts that could benefit from Wexus' platform, feel free to point them to these links above or email us at ops@wexusapp.com.
- If you're interested in irrigation equipment upgrades or retrofits - like VFD's - you can get up to $100/Hp in utility rebates. We can help you meander the paperwork and requirements so you get paid $$$.
- For product and news updates, case studies and product tutorials check out our blog page here.
- Be sure to follow us for the latest updates and news on Twitter, LinkedIn and YouTube.