Let's face it: energy bills are designed to be confusing! But don't worry. We're here to help you make sense of what you're being charged so you can take action to reduce costs and control your energy usage.
California Energy Market: The Nation's Largest And Most Expensive "Time of Use" (TOU) Energy Rate Rollout
Many energy utilities charge their customers based on a "flat" rate. You pay a fixed cost per kilowatt-hour (kWh) based on how much total energy you use.
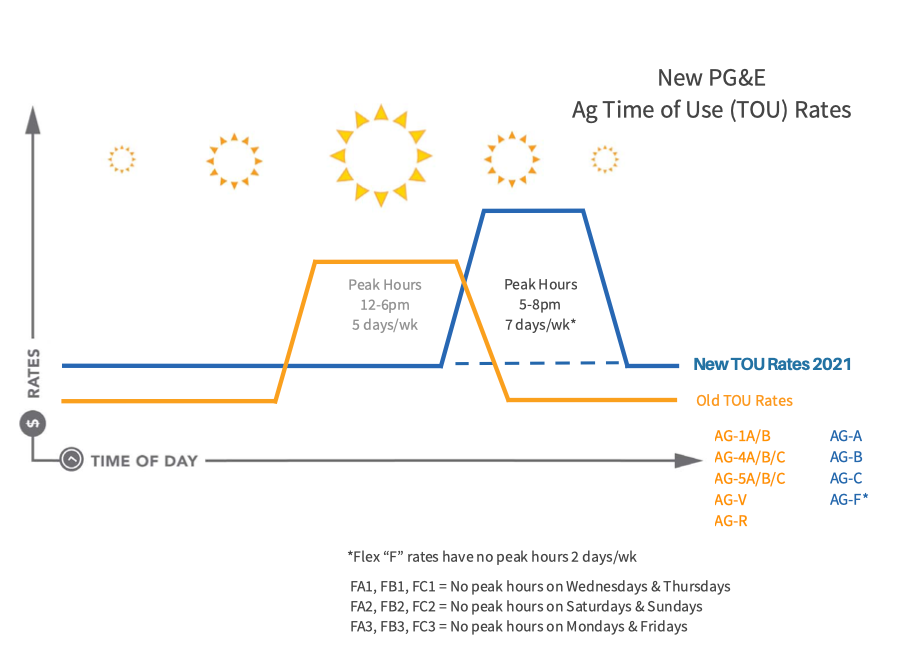
But in 2021, California rolled out the nation's largest Time of Use (TOU) utility rate changes.
"Time Of Use" means you pay more for both energy AND power during "peak" times of the day when the utility grid has the most demand from consumers. This rate structure has also been adopted by many other utilities around the world.
Energy 101: How Is My Utility Bill Calculated?
It's really important to understand HOW your energy bill is calculated and what your bill charges actually mean.
Time of Use (TOU): WHEN you use energy is just as important as HOW MUCH you use
Under TOU rates, you pay more for electricity during weekday AND weekend afternoons usually between 4pm-9pm, seven days a week. And those costs on your utility bill are broken out between two different types of costs: energy charges and power (i.e "demand") charges.
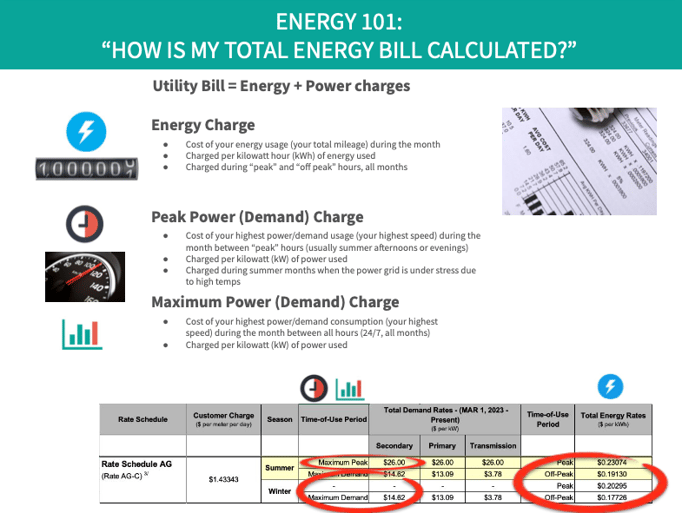
Your Utility Bill = Energy + Power Charges
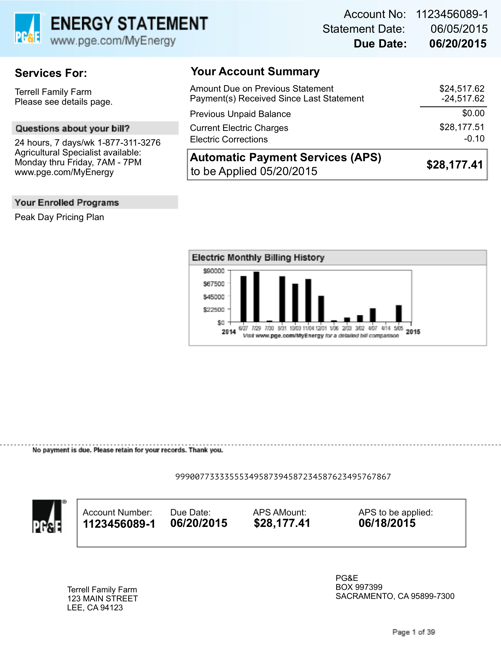
A sample utility bill from PG&E.
Energy Usage (the "odometer")

- Cost of your energy usage - your total mileage - during the month between all hours 24/7, all year
- Charged per kilowatt hour (kWh) of energy used
Peak Energy Usage (the "odometer")
- Cost of your energy usage - your total mileage - during the month between “peak” hours only
- Charged per kilowatt hour (kWh) of energy used
- Charged during summer months when the power grid is under stress due to high temps

- Cost of your highest power/demand consumption - your highest speed - during the month between all hours 24/7, all year
- Charged per kilowatt (kW) of power used
Peak Power Usage (the "speedometer')
- Cost of your highest power/demand usage - your highest speed - during the month between “peak” hours - usually summer afternoons or evenings
- Charged per kilowatt (kW) of power used
- Charged during summer months when the power grid is under stress due to high temps
Confusing? YES. And it's designed to be that way so you just give up and pay your bill without asking too many questions. Hopefully our charts below explain it a little more clearly:
Check out this specific example and breakdown for an irrigation pump on a PG&E "agricultural" utility rate:
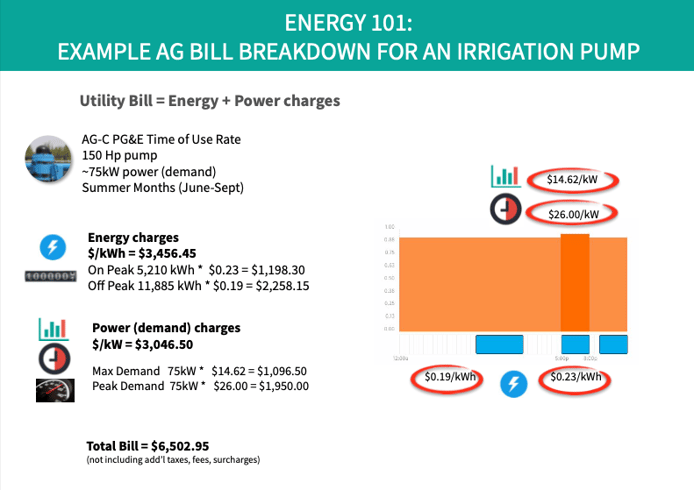
As you can see above, irrigating with this one pump during the summer when crops need the most water would cost ~$6,500 in energy and power costs for a single month. Multiply that by dozens of electric irrigation pumps across a farm and utility bills can easily climb into the hundreds of thousands of dollars PER MONTH.
During the "peak" evening hours from 5-8pm, both the energy "demand" costs and the power "demand" costs get very expensive and eat up almost HALF of a utility bill.
So avoiding or offsetting energy + power usage during these hours could result in monthly bill savings of up to 50%.
What Are The TOU Charges in California?
On average, TOU rates cost about $0.45/kWh when you include or "blend" in the peak power demand and peak energy costs.
By comparison, the average cost of energy in the United States is only $0.15/kWh.
To add insult to injury, peak power "demand" costs can reach as high as $26 PER KILOWATT (kW)!
- 💸 PG&E AG-A rates are now ~$0.46/kWh
- 💸 PG&E AG-B rates are now ~$0.42/kWh
- 💸 PG&E AG-C peak demand charge increased ~$7 to $26/kW
- 😱 PG&E AG-FA peak energy charge is now $0.53/kWh
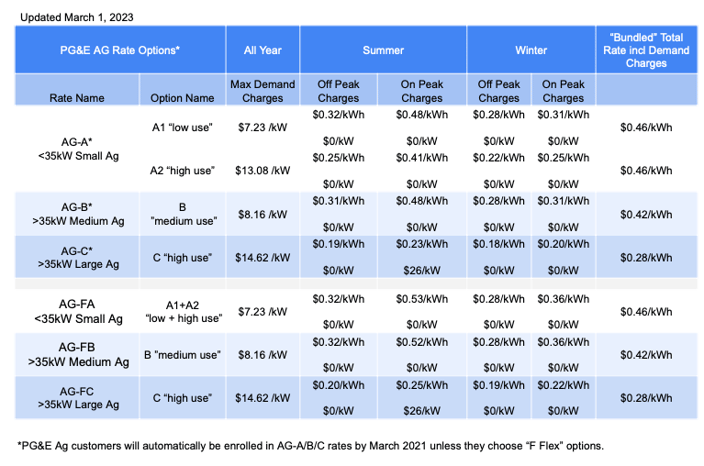
Recent cost breakdown by PG&E Agricultural rate, showing both energy and demand charges.
So what's the bottom line for my farm?
Farms that have invested in on-site solar projects need to watch this closely. They may - or may not - see their original expected savings and ROI promised by their original solar contract now that these new rates are live.
Older solar projects that were connected to the grid can keep their net energy metering (NEM) on their original utility rate plans i.e. "grandfathering" at least for a few more years. Newer solar projects, however, don't have this option and will have to enroll in the new, costlier rate plans. For larger operations, investing in on-site energy storage or battery systems could be a compelling option to avoid the new, costly peak hours between 5-8pm - assuming you can afford the equipment and installation costs.
Our software quickly analyzes these new TOU rates and matches them with your energy bills and consumption, your solar generation, and your irrigation pump loads over the past few years to automatically select the cheapest TOU rates and maximize your cost savings. Doing this manually is impossible.
 Wexus "cost calculator" tool helps predict your energy and demand costs in advance, based on your estimated usage/irrigation schedule.
Wexus also tracks and monitors your solar assets for you. It tracks your "grandfathered" solar rates and solar meters so that you don't prematurely switch to a different solar rate. Wexus monitors your solar systems' performance and flags any operations/maintenance costs to keep your system running in top shape. This helps to maximize your solar ROI and keep your $ savings on track. Our software also identifies sites and meters/consumers that may be good candidates for new solar arrays and/or energy storage systems - based on your historical energy usage, costs and irrigation schedules.
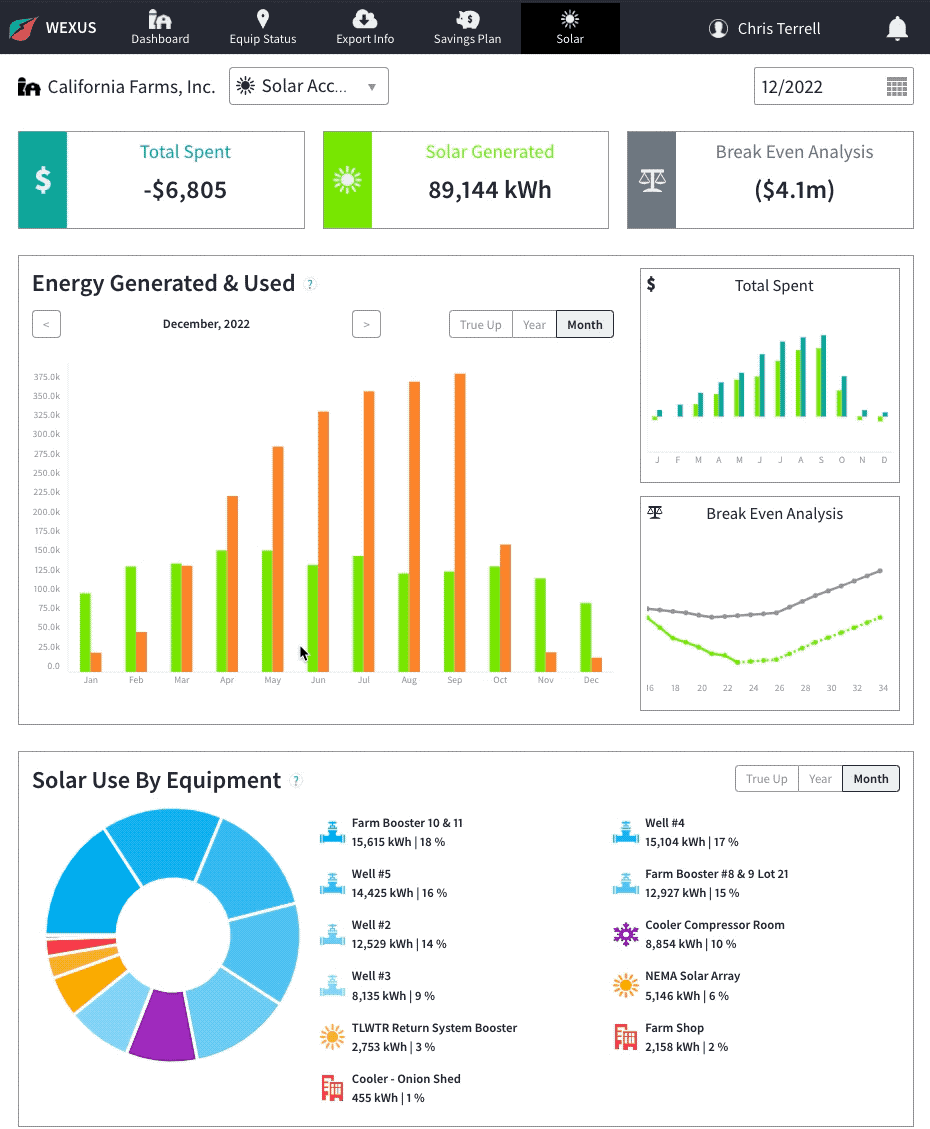 Wexus "solar dashboard" tracks your solar energy production, consumption, solar bills and ROI all in one place.
All of these changes are clear as mud. I have a business to run. What should I do next?
You're not alone. We're seeing changes in the energy landscape faster than ever before. So leave the heavy-lifting to Wexus software and our team of experienced energy industry veterans.
How Can I Sign Up for a Free Wexus Software Demo with My Data?
If you’d like more information about how Wexus’ software platform can track and reduce your utility bills and drive efficiency across your farming operation - click here to schedule a free demo - or contact us at info@wexusapp.com.